Covid-19 Evening Stats, April 06
My main motive for this private statistics series is the desire to observe the changes in the registered Covid-19 cases and the time course of the disease. The media report the maximum numbers and changes from the previous day, but only the long-term observation provides information about when and how strongly the political measures are working.
I have added two additional curves to my chart. One (light blue) shows the course of the percentage changes compared to the previous day, the other shows the development of the Basic reproduction number R₀ (dark red), as reported by the Robert Koch Institute (RKI).
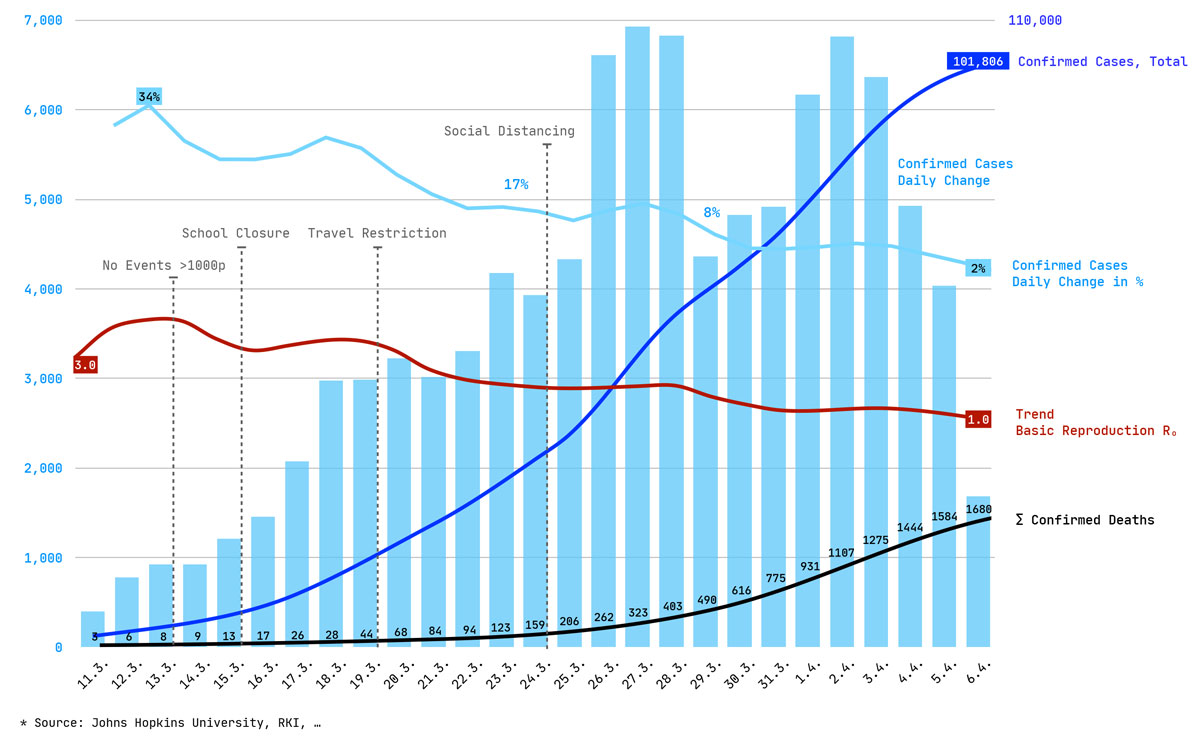
Today’s Covid-19 situation in Germany: new cases (light blue bars), daily change [%] (light blue curve), all cases (dark blue curve), deaths (black), and trend of Basic reproduction number R₀ (reported by RKI)
Sum of confirmed cases (dark blue curve): The development of this amount/number is suitable for showing a country-specific course of the epidemic, but not for international comparisons. The number of cases depends mainly on the number of tests. However, the number does not say anything about the actual amount of infected persons. Its disadvantage is that when the quantity of tests is increased, the curve loses its power as a sample. Another drawback for the statistics: the curve rises and rises, often due to the increase in tests alone, and due to the large total number of cases, the desired flattening can hardly be detected.
Daily change of confirmed cases (light blue bars): A change can be read much more directly from the course of the daily new cases registered. However, the disadvantage built in here is that with the steady increase in the total of registered cases, the absolute numbers of the daily plus are also increasing. Example: If we are in the double digits, the increase of 20 cases from one day to the next sounds small … but it means +50% if there were 40 cases the day before. The jump from 10,000 to 11,000 cases is equivalent to 1,000 new cases, but only a +10% increase. Conclusion: Percentage is the solution.
Daily change of confirmed cases [%], Doubling time (light blue curve): The percentage change in the number of new daily cases most visibly illustrates any trend reversal in the case numbers. Based on the percentage, the doubling time of the virus can be calculated very quickly (see also Fontblog: Ganz einfach die Ausbreitung des Virus ausrechnen). To do this, divide 72 by the percentage of the daily change: 72/Δ%. With the recent 4% (April 5), the current doubling time is 18 days.
Growth rate: Virologists have deduced from experience in China and Italy that the number of reported cases – unchecked – doubles every 3 days. The growth rate is therefore calculated by dividing the number of cases of the current day by the number of cases 3 days before.
Basic reproduction number R₀: The basic reproduction number of an infection can be thought of as the expected number of cases directly generated by one case in a population where all individuals are susceptible to infection. The definition describes the state where no other individuals are infected or immunized (naturally or through vaccination). R₀ is not a biological constant as it is also affected by other factors such as environmental conditions and the behavior of the infected population. Since I have no possibility to calculate R₀, I use the data of the RKI.
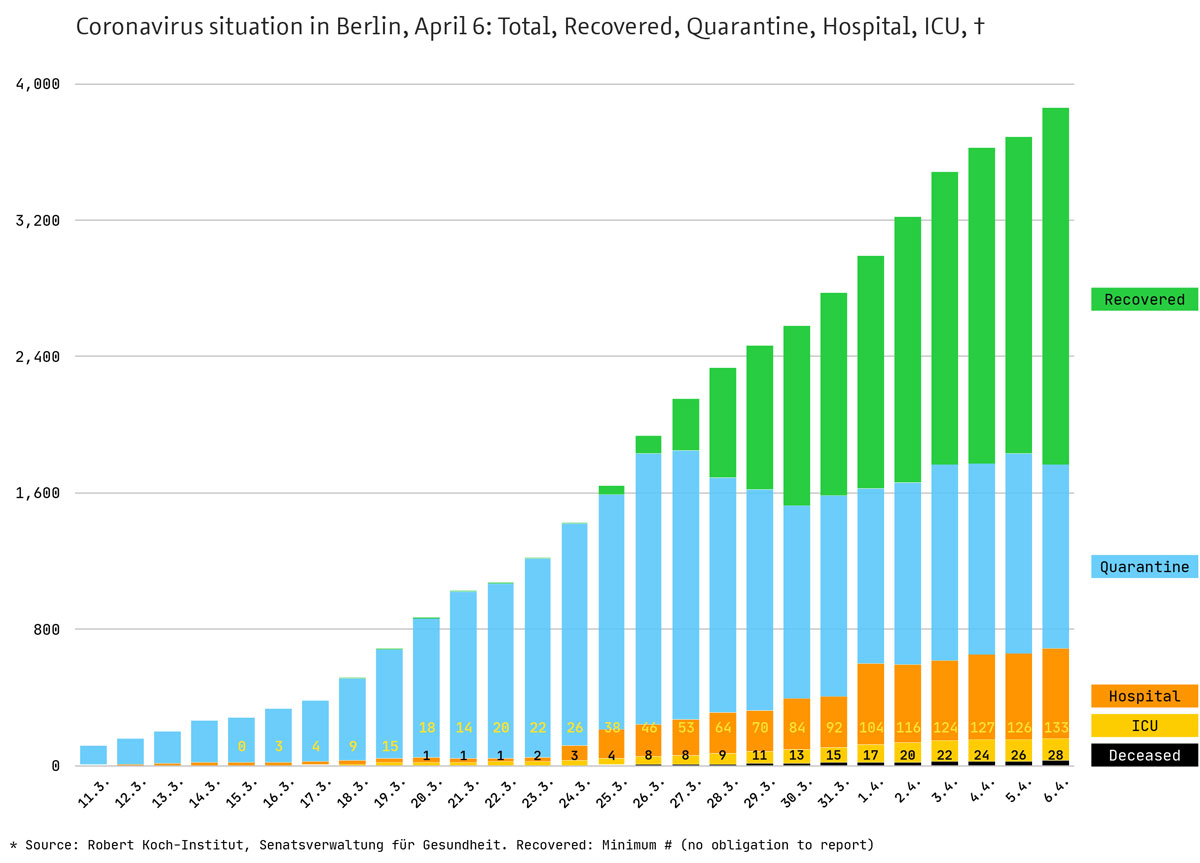
Covid-19 situation in Berlin, April 6: recovered (green), quarantine (blue), hospital (orange), ICU (yellow), deaths (black)
The April 6 table:
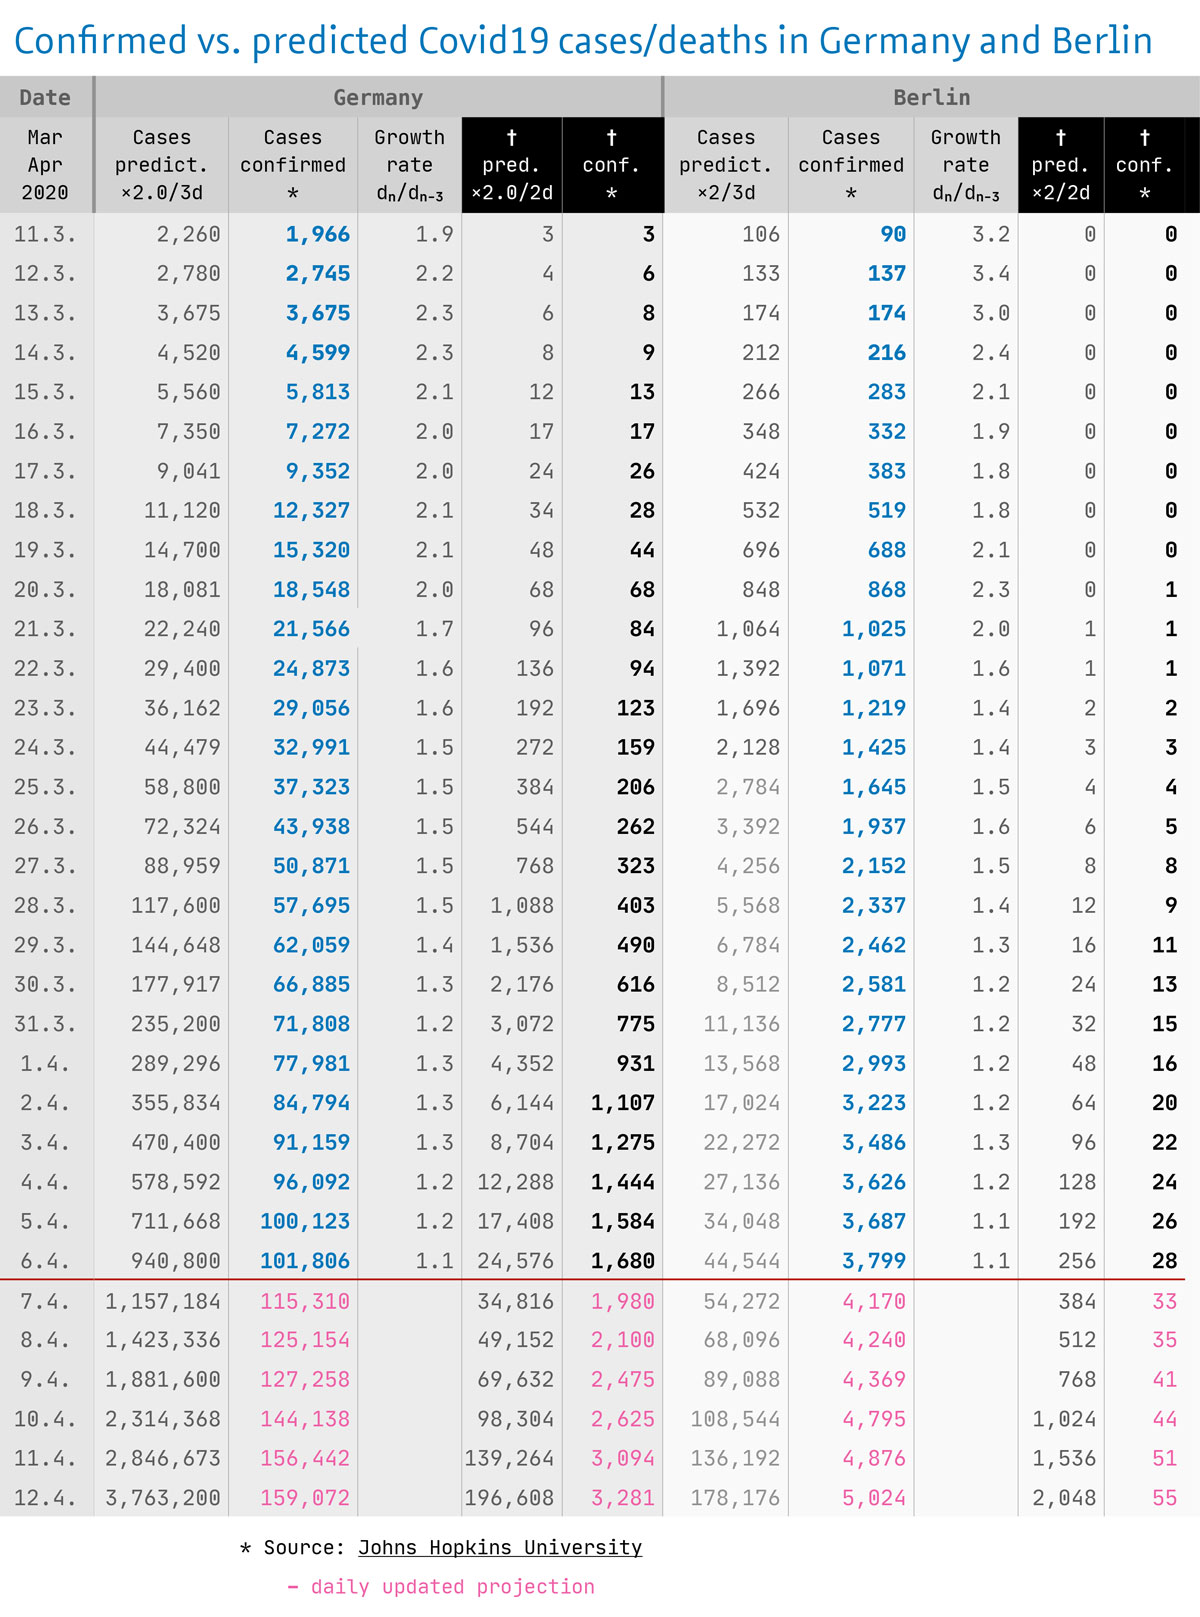
Covid-19 Table Germany and Berlin, April 6
Author’s note: The above values are purely speculative estimations using simple mathematical modelling (based on registered cases/deaths) and are not confirmed by health authorities nor any other national public authority.
<em>kursiv</em> <strong>fett</strong> <blockquote>Zitat</blockquote>
<a href="http://www…">Link</a> <img src="http://bildadresse.jpg">