Daily Covid19 Stats Nº 22
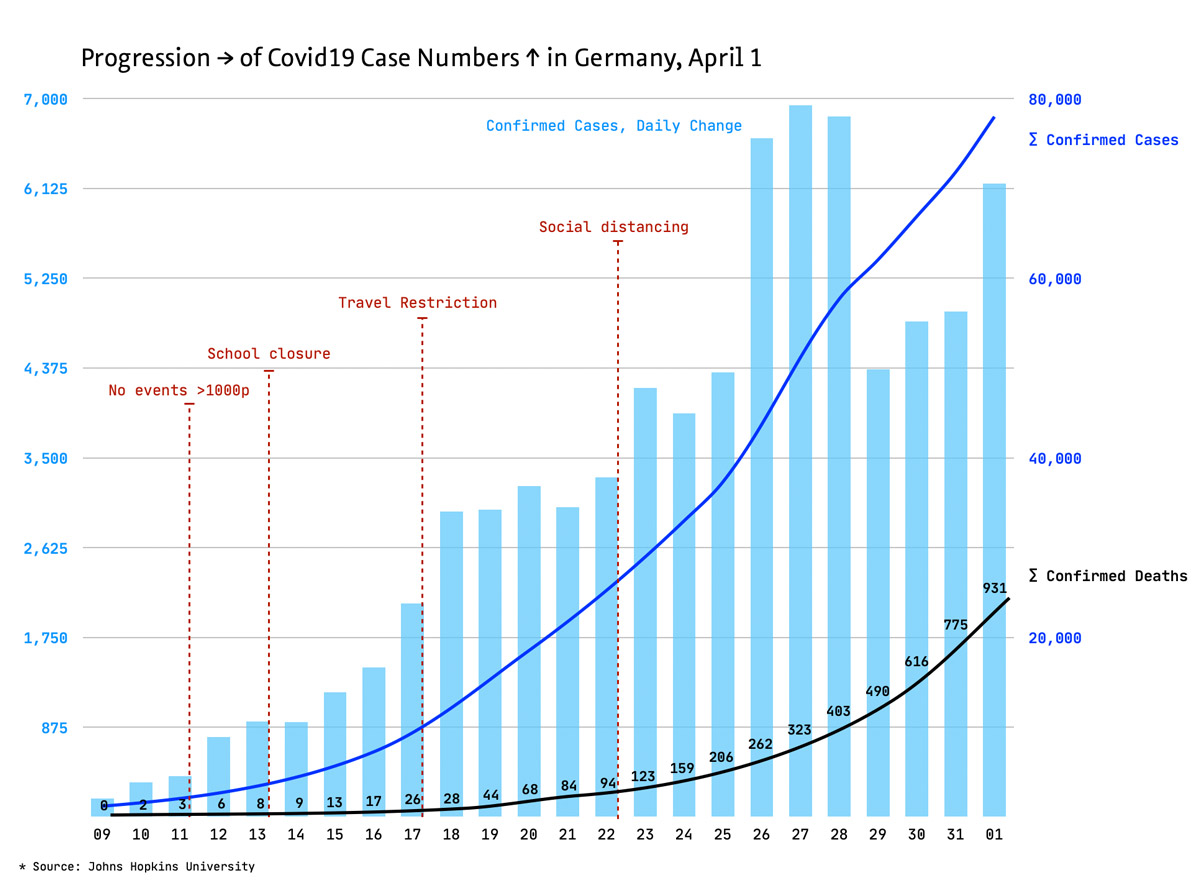
Progression of Covid19 new cases, all cases, and deaths in Germany, April 1
End of Day Summary (22). Yesterday night I decided to set the publication date of my charts (Twitter & blog) from evening to morning because the figure sources are too much in motion at the end of the day.
The picture above shows the increase of the registered Covid19 cases in Germany, from March 9–April 1. The focus is on the daily new cases (light blue bars), where the flattening of the infections is more apparent than in the dark blue curve with the summed cases. The deaths are now visualised with a black, scaled line in order to better recognise the growth; on the line you see the cumulated case numbers.
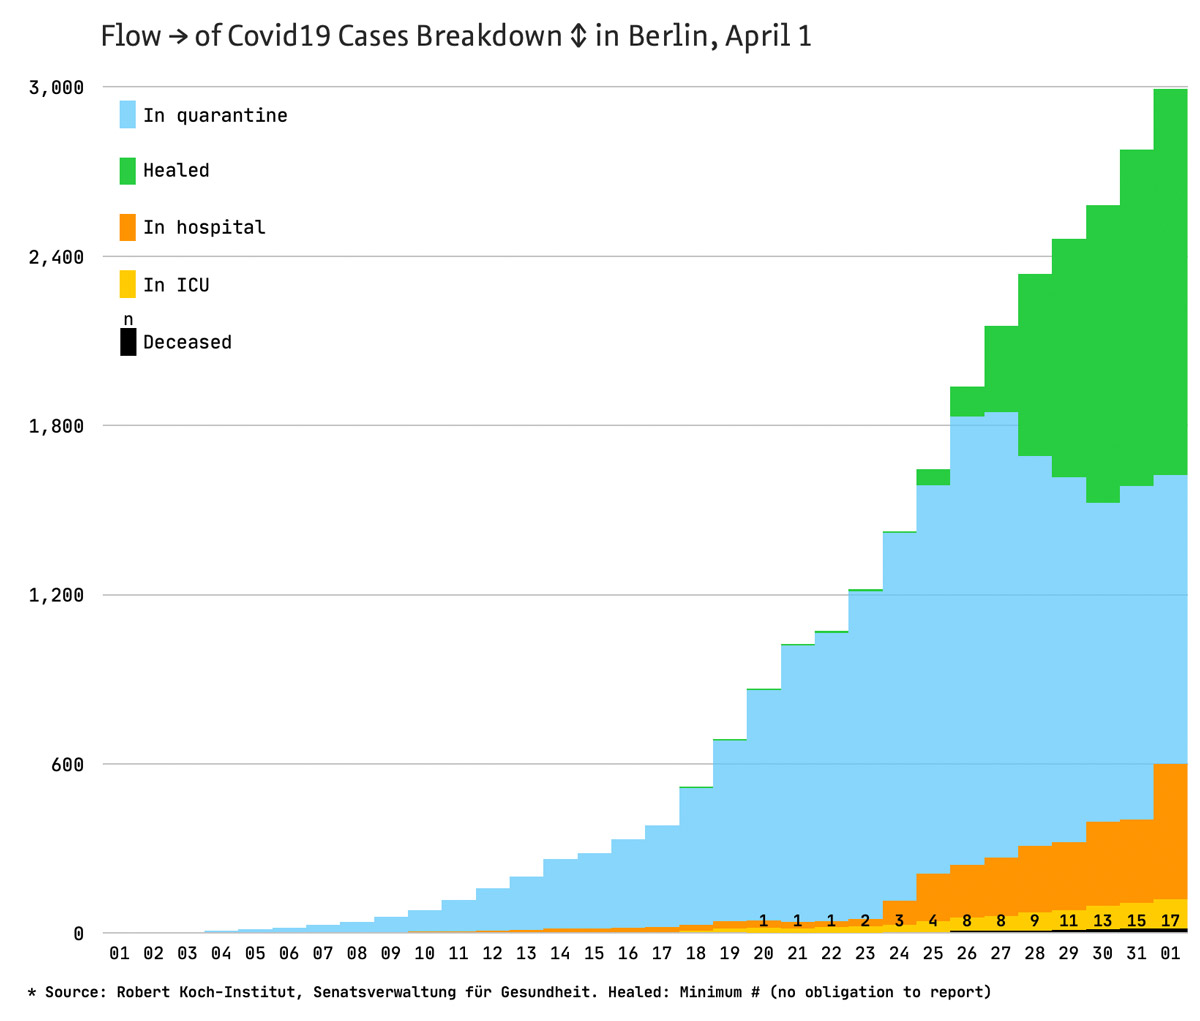
Covid19 situation Berlin, April 1: healed (green), in quarantine (blue), in hospital (orange), in ICU (yello), deaths
The second picture (above) is dedicated to the coronavirus conditions in my hometown Berlin. At the suggestion of some Twitter followers, I have now added up the total number of registered cases against 5 subgroups: the cured (green), the people in domestic quarantine (blue), the Covid19 patients (orange), the severe ICU cases (yellow) and the deaths (black with figures).
You can hardly see it in this presentation, but in the table below: The growth rate in Berlin has now been constant for three days at 1.2 (corresponds to a doubling in about 10 days). Surprisingly, deaths in the city are not growing exponentially but linearly in the last 4 days.
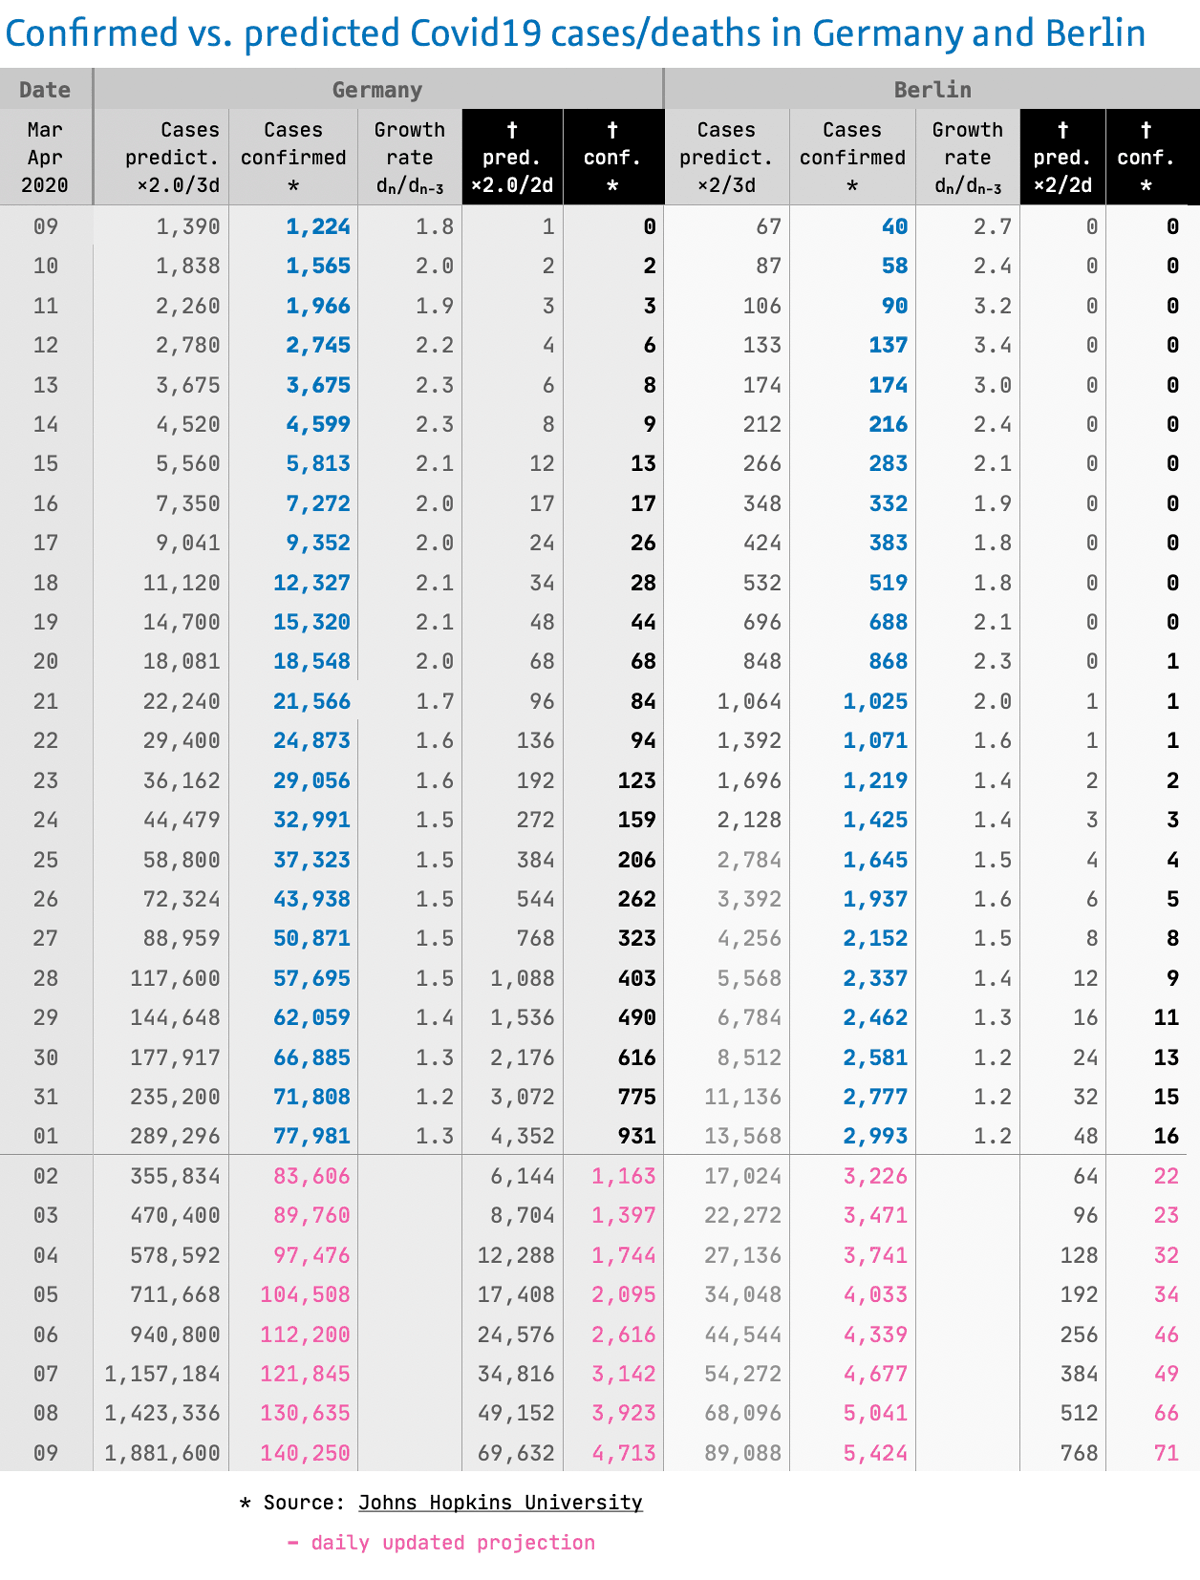
The complete Picture (table):
Today, the number of registered cases in Germany has risen by 6,173, and thus the development ha2 increased to a higher growth rate of ×1.3. Let us hope that this can be explained by the large increase in tests. We have to consider: If the number of tests increases dramatically, it naturally distorts the course of our sample.
The increase in the number of deaths has also slowed today, to ×1.5 (from ×1.6 yesterday), which means a doubling in 5 days.
Author’s note: The above values are purely speculative estimations using simple mathematical modelling (based on registered cases/deaths) and are not confirmed by health authorities nor any other national public authority.
<em>kursiv</em> <strong>fett</strong> <blockquote>Zitat</blockquote>
<a href="http://www…">Link</a> <img src="http://bildadresse.jpg">